Relative strength Index or just RSI, is a very popular indicator developed by J.Welles Wilder. RSI is a leading momentum indicator which helps in identifying a trend reversal.
RSI indicator oscillates between 0 and 100, and based on the latest indicator reading, the expectations on the markets are set.
RSI is the most popular leading indicator, which gives out strongest signals during the periods of sideways and non trending ranges.
A value between 0 and 30 is considered oversold, hence the trader should look at buying opportunity.
A value between 70 and 100 is considered overbought, hence the trader should look at selling opportunity.
If the RSI value is fixed in a region for a prolonged period, it indicates excess momentum and hence instead of taking a reversed position, the trader can consider initiating a trade in the same direction.
Example:
In the below chart of M&M Finance, the 15 min chart and 5 min charts are shown.
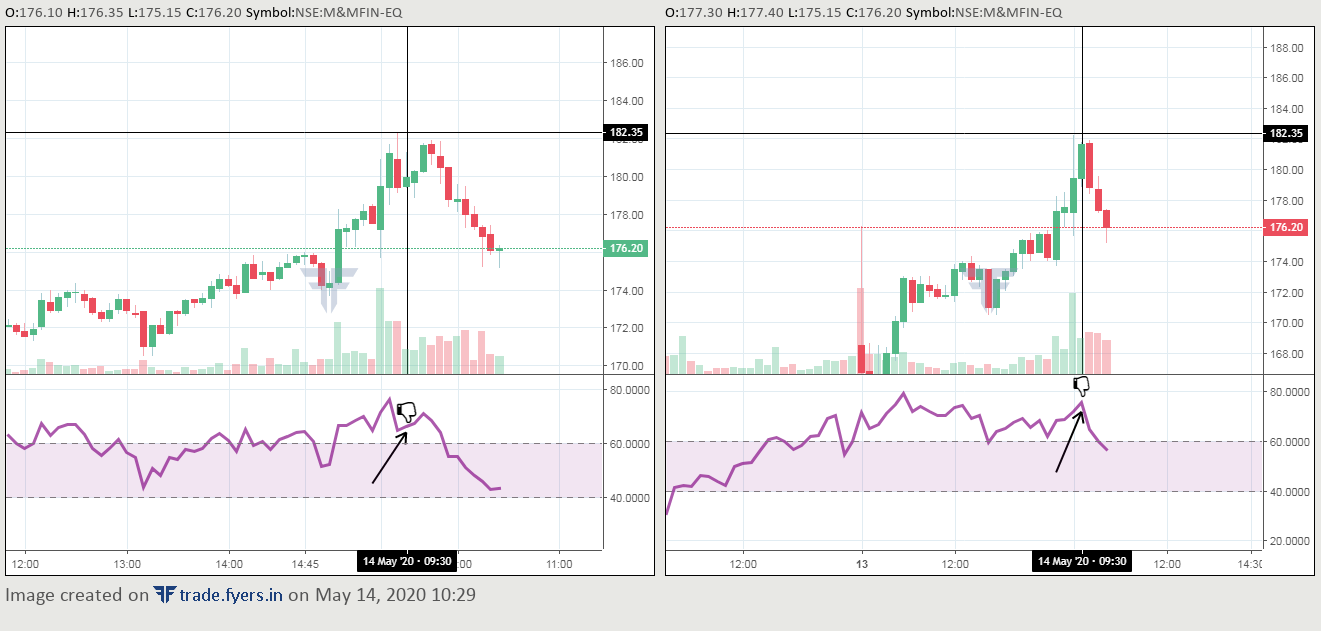 |
| M&M Finance chart |
In 15 min chart RSI starts falling at 9.30 am and in 5 min chart it was rising. I have shown this with thumbs up emoji. This is the clear indication of fall in the price and subsequently the price have fallen sharply. Traders can use this opportunity to short sell.
Enroll for Technical analysis course and make money from home
Comments
Post a Comment