A golden cross is considered a bullish sign.
It occurs when the 50-day moving average rises above 200-day moving average.
The golden cross is a technical chart pattern indicating the potential for a major rally.
The golden cross appears on a chart when a stock’s short-term moving average crosses above its long-term moving average.The golden cross can be contrasted with a death cross indicating a bearish price movement.
Example:
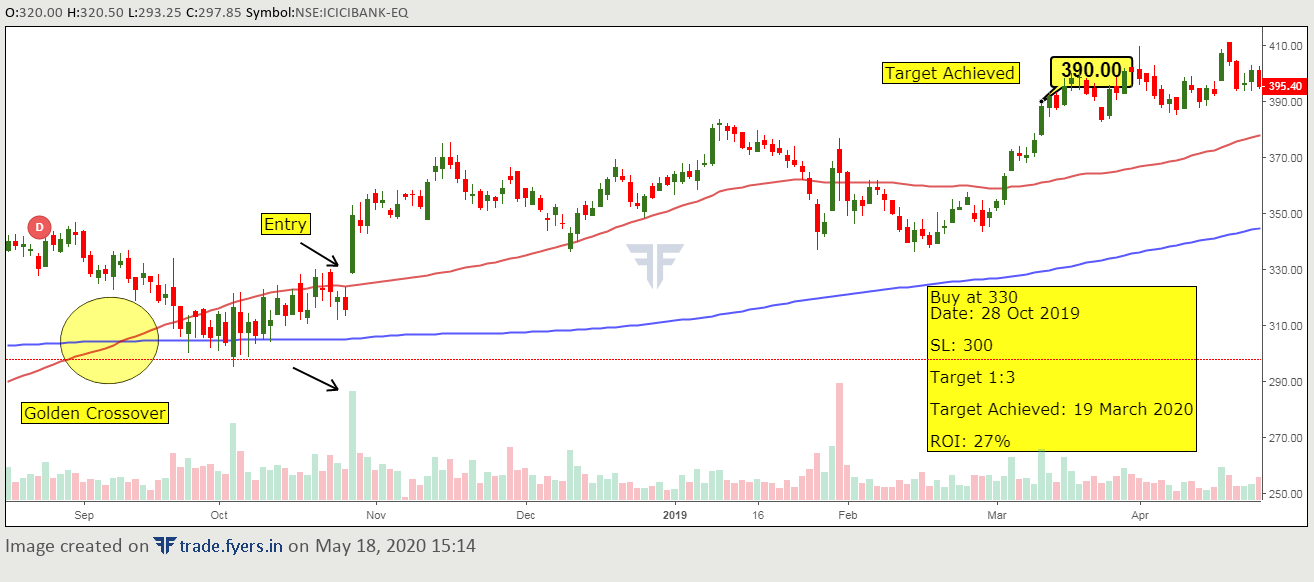 | ||
ICICI Bank Daily Chart
|

Comments
Post a Comment